8 States Where Car Insurance Is Brutal in 2026
The national average is $2,513 a year for full coverage. In these eight states, drivers pay a small fortune more — here is the data, and how to check your own rate in two minutes.
If your car insurance bill keeps climbing and you can't figure out why, geography is a bigger factor than most drivers realize. Where you park your car at night can swing your premium by thousands of dollars a year — for the exact same driver, the exact same car, and the exact same coverage.
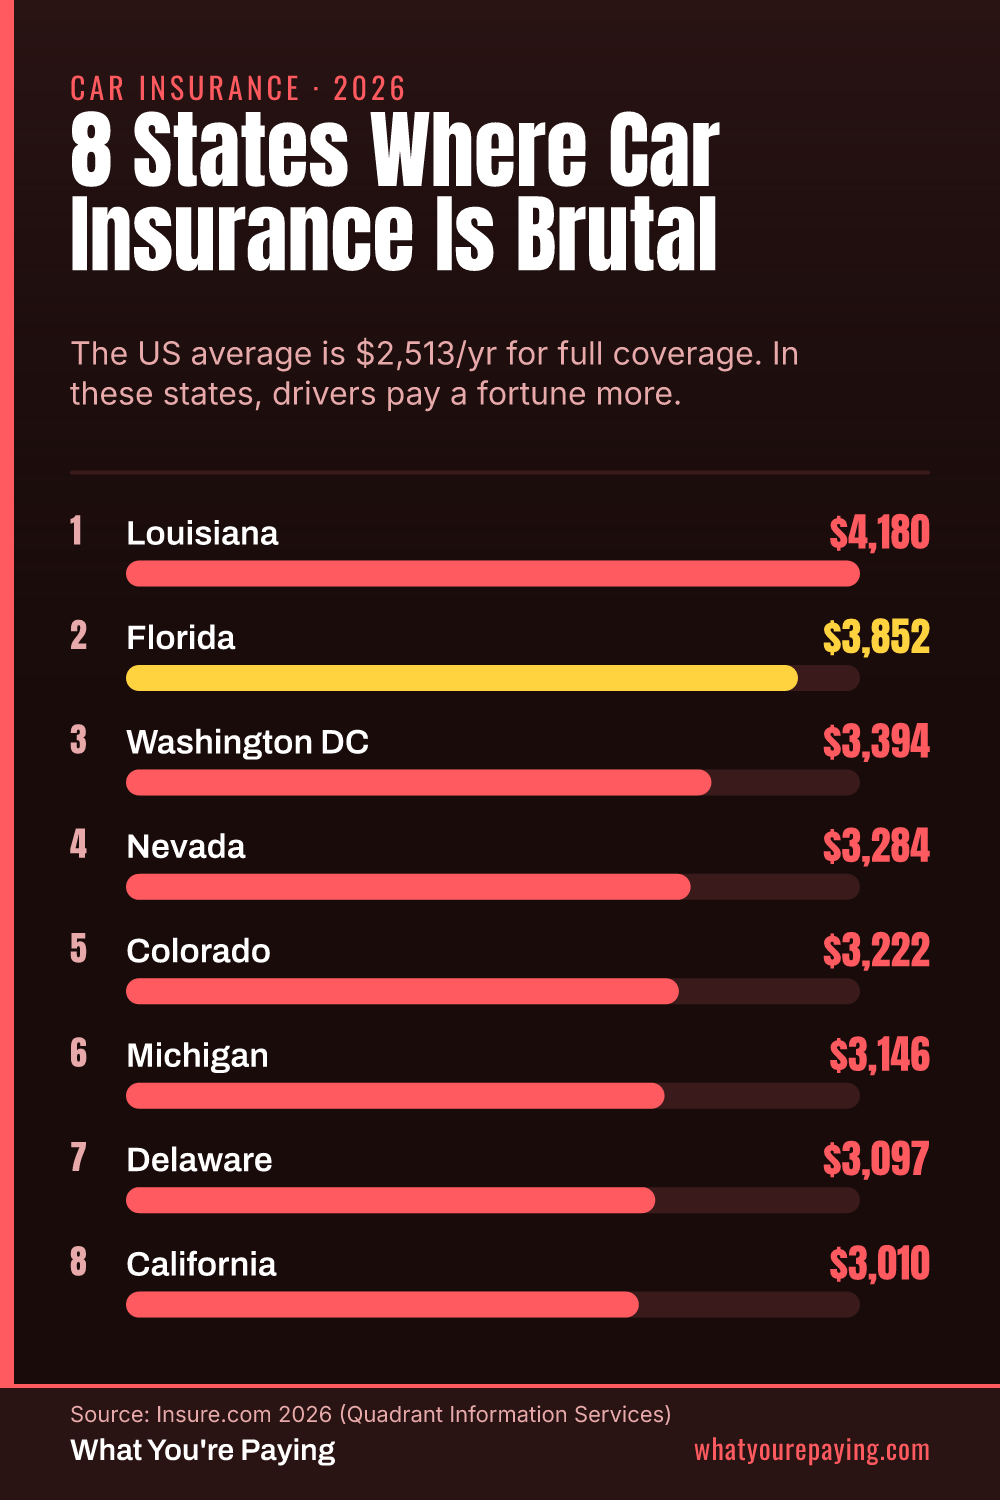
According to Insure.com's 2026 analysis of more than 75 million rate records across 169 insurance companies, the national average for full-coverage car insurance is $2,513 per year. But the eight states above blow past that. Louisiana tops the list at $4,180 a year — roughly 66% above the national average — driven by heavy litigation, severe weather, and high accident rates. Florida ($3,852) isn't far behind.
📩 Get the free 2026 Car Insurance Rate Report (all 50 states)
We'll send you the full state-by-state breakdown plus the 7 questions that move your rate the most. Free, no obligation.
Here's the part most people don't act on: insurers price the same driver very differently, and they raise rates on existing customers far faster than they quote new ones. The single most effective move — recommended by nearly every consumer-finance outlet — is to re-shop your policy every 6 to 12 months. Loyalty is quietly expensive.
If you live in one of these high-cost states, the gap between the best and worst quote on identical coverage is often $1,000 or more per year. You don't have to switch anything to find out — comparing quotes is free and takes about two minutes.
Compare Car Insurance Rates — Free, 2 Minutes →Common questions
Is comparing quotes really free?
Yes. Getting quotes is free with no obligation to switch. You only change anything if a better rate is worth it to you.
Why is car insurance so expensive right now?
Full-coverage prices rose roughly 43% from 2021 through 2025 (Insurify), driven by higher repair costs, pricier vehicles, and more severe accidents. Rates are expected to rise only ~1% in 2026 — which makes now a good time to lock in a better one.
Does my state really change my rate that much?
Yes. State rules, weather, litigation, and accident rates mean the same driver can pay over $2,500 more per year in the most expensive state versus the cheapest.
Sources
- Insure.com 2026 — Car insurance rates by state
- Insurify 2026 — Average car insurance cost report